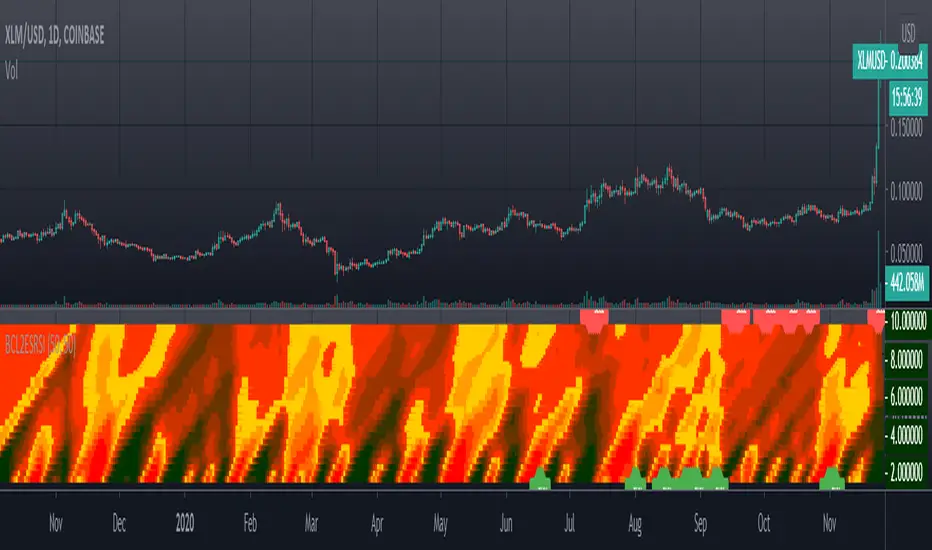
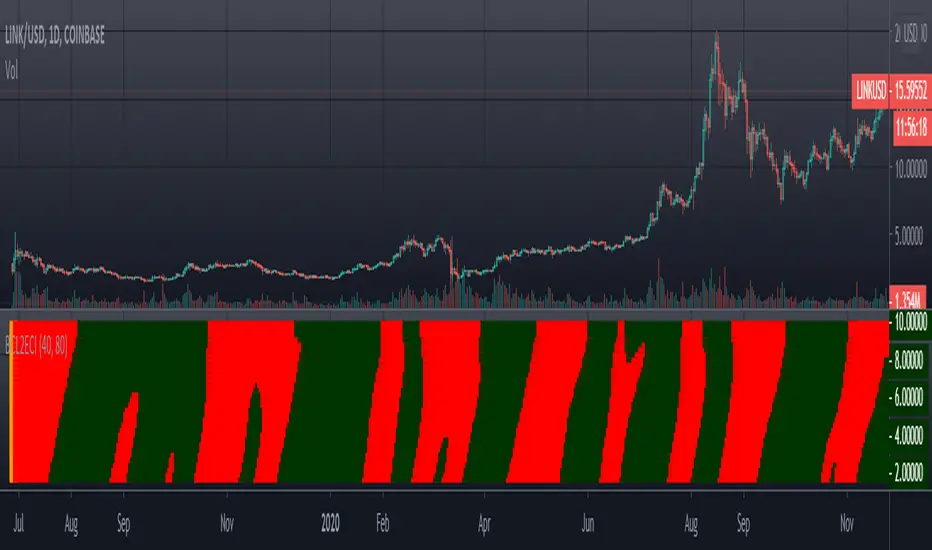
[blackcat] L2 Ehlers DFT-Adapted RSILevel: 2
Background
John F. Ehlers introuced his DFT-ADAPTED RELATIVE STRENGTH INDEX (RSI) in Jan, 2007.
Function
In "Fourier Transform For Traders" in Jan, 2007, John Ehlers presented an interesting technique of improving the resolution of spectral analysis that could be used to effectively measure market cycles. Better resolution is obtained by a surprisingly simple modification of the discrete Fourier transform. John Ehlers suggests using the discrete Fourier transform (DFT) to tune indicators. Here, I demonstrate this by building a DFT-adapted relative strength index (RSI) strategy.
Rather than display the RSI for a single cycle length across the entire chart, Ehlers DFT adaptive RSI value reflects the DFT-calculated dominant cycle length RSI. If the dominant cycle changes from 14 to 18 bars, the RSI length parameter changes accordingly. Computationally, this requires the strategy to continuously update values for all possible RSI cycle lengths via a "for" loop and array.
In details, a full-featured formula that implements a high-pass filter (HP) and a six-tap low-pass finite impulse response (FIR) filter on input, then does discrete Fourier transform calculations. I has taken liberty of adding extra parameters so the user can modify the analysis window length and the high-pass filter cutoff frequency in real time using the parameters window. Once the suite of possible RSI values is calculated, we use the DFT to select the relevant RSI for the current bar. The strategy then trades according to J. Welles Wilder's original rules for the RSI.
Key Signal
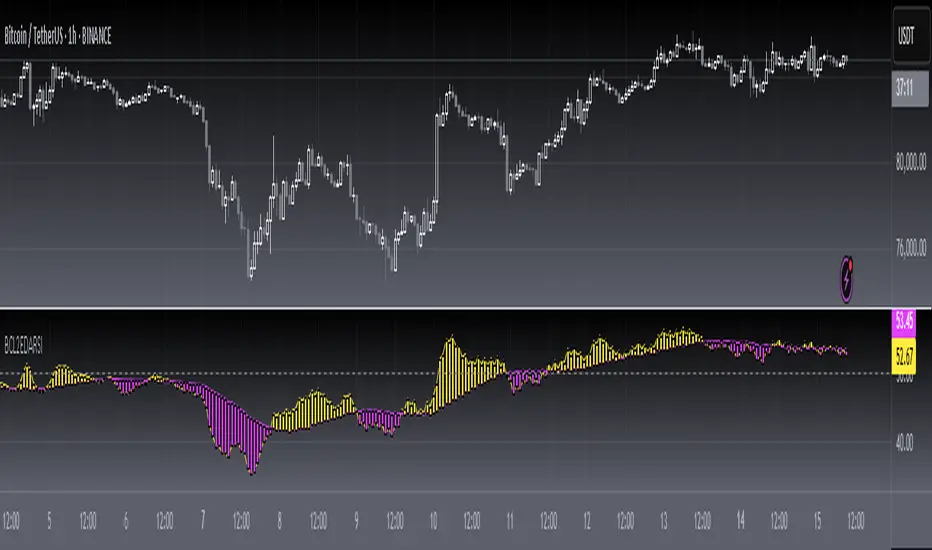
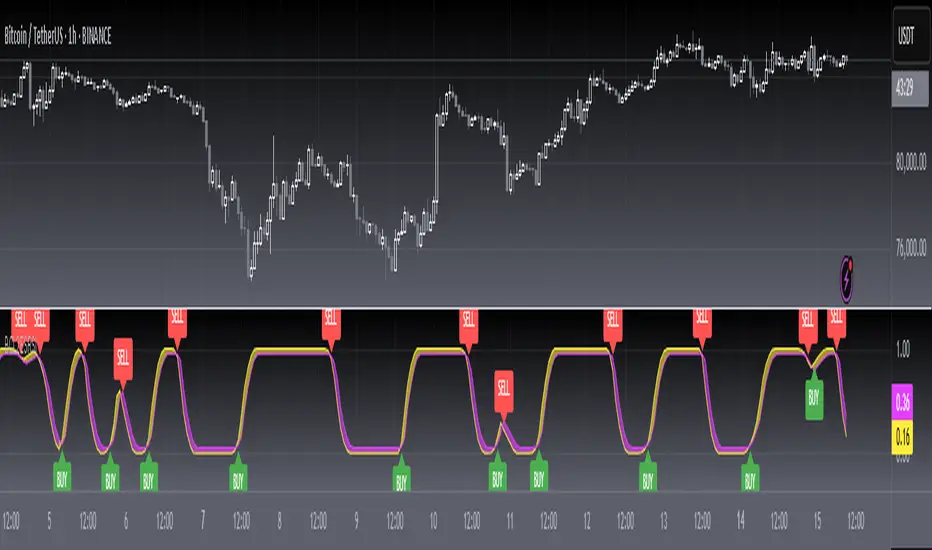
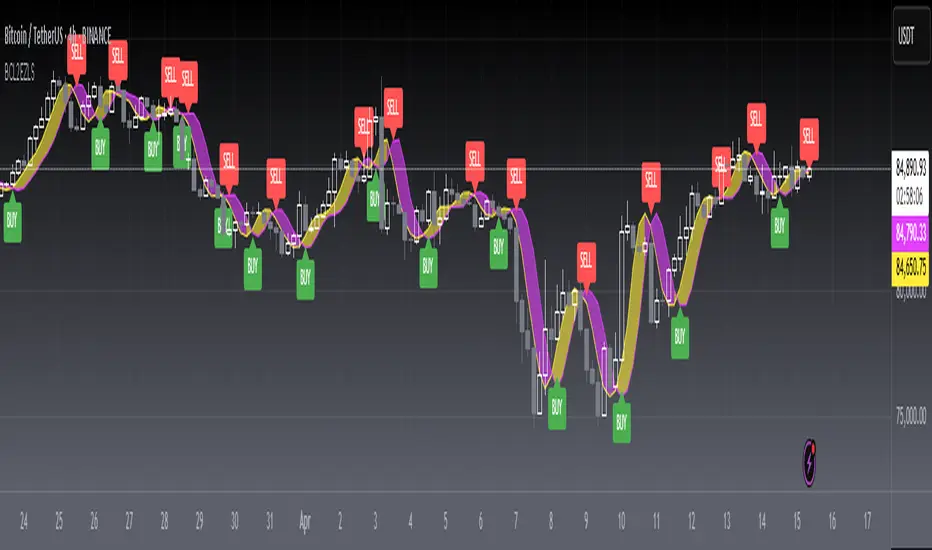
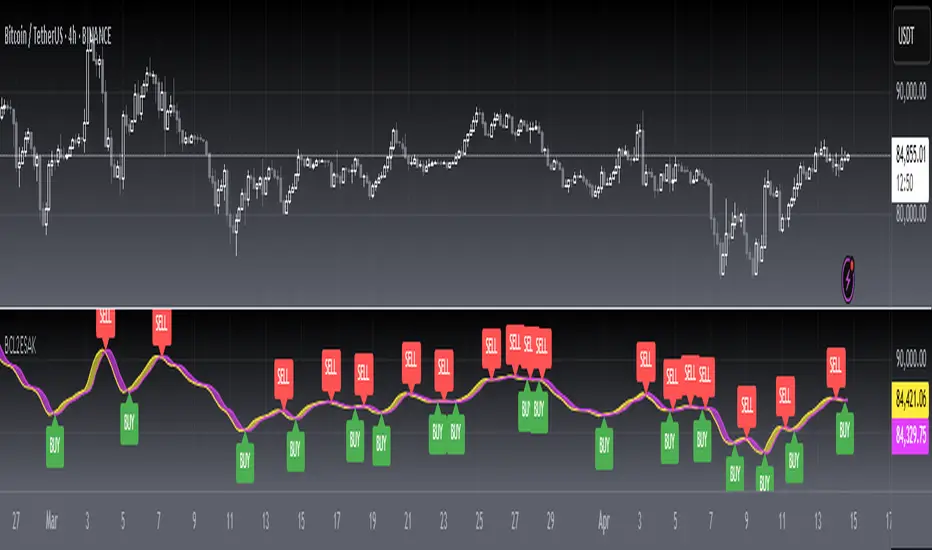
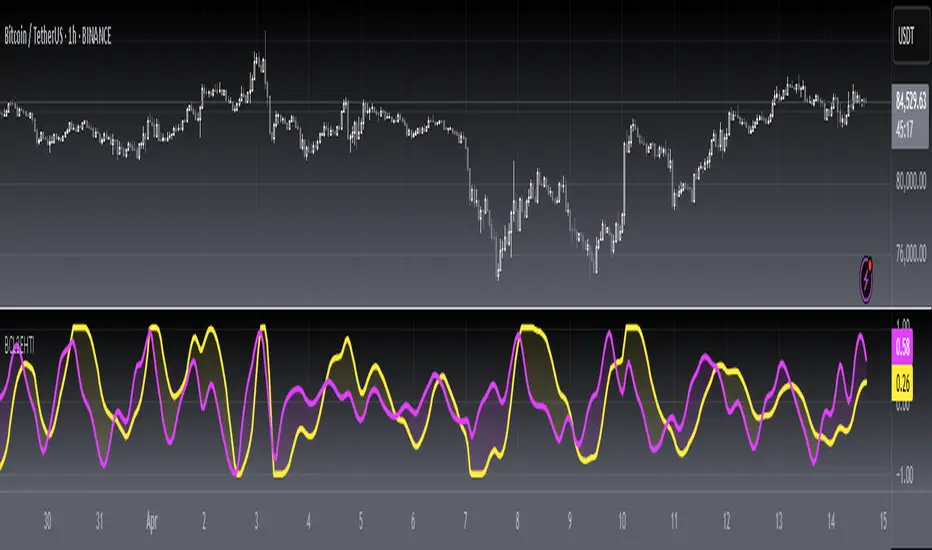
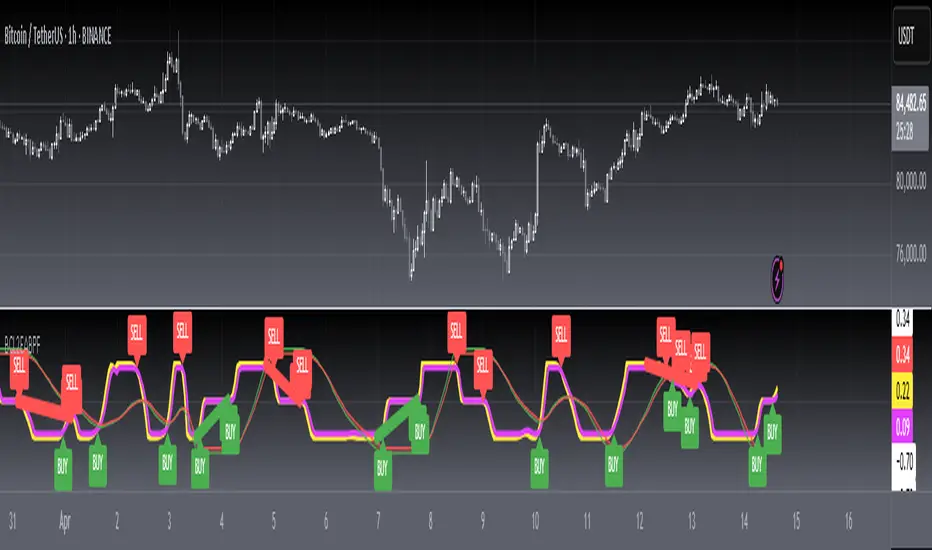
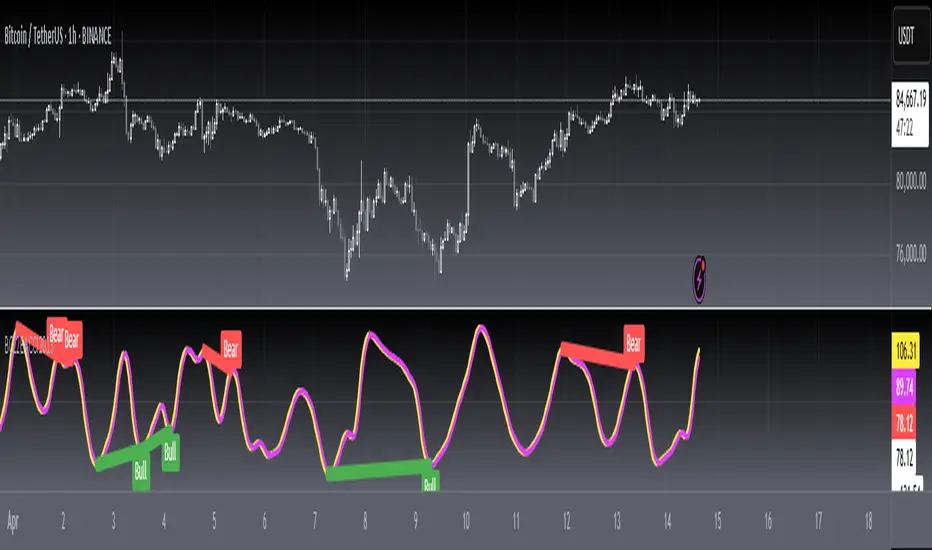
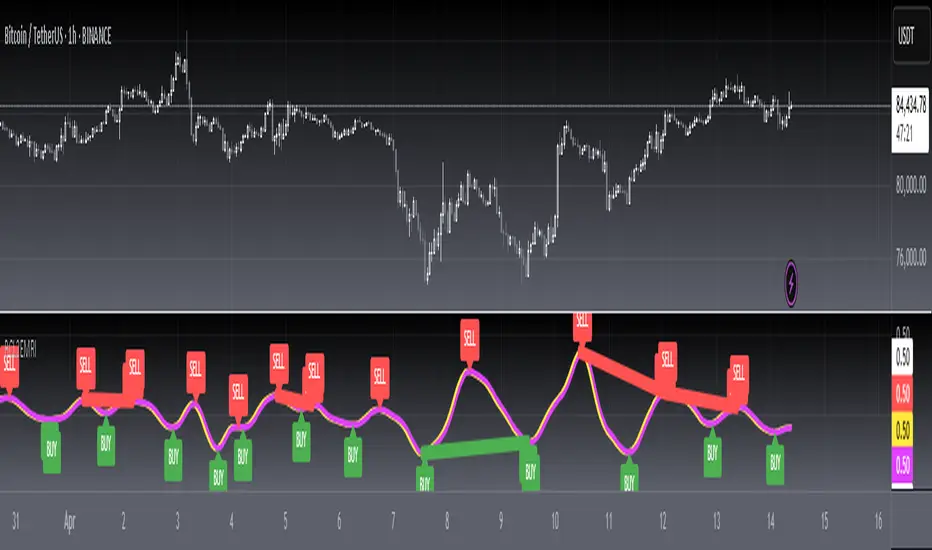
fastline--> DFT-ADAPTED RELATIVE STRENGTH INDEX (RSI) fast line
slowline--> DFT-ADAPTED RELATIVE STRENGTH INDEX (RSI) slow line
Pros and Cons
100% John F. Ehlers definition translation, even variable names are the same. This help readers who would like to use pine to read his book.
Remarks
The 71th script for Blackcat1402 John F. Ehlers Week publication.
Based on original work of Ehlers, I added ALMA smoothing on DFT-adapted relative strength index (RSI) so that clearer trend can be observed.
Readme
In real life, I am a prolific inventor. I have successfully applied for more than 60 international and regional patents in the past 12 years. But in the past two years or so, I have tried to transfer my creativity to the development of trading strategies. Tradingview is the ideal platform for me. I am selecting and contributing some of the hundreds of scripts to publish in Tradingview community. Welcome everyone to interact with me to discuss these interesting pine scripts.
The scripts posted are categorized into 5 levels according to my efforts or manhours put into these works.
Level 1 : interesting script snippets or distinctive improvement from classic indicators or strategy. Level 1 scripts can usually appear in more complex indicators as a function module or element.
Level 2 : composite indicator/strategy. By selecting or combining several independent or dependent functions or sub indicators in proper way, the composite script exhibits a resonance phenomenon which can filter out noise or fake trading signal to enhance trading confidence level.
Level 3 : comprehensive indicator/strategy. They are simple trading systems based on my strategies. They are commonly containing several or all of entry signal, close signal, stop loss, take profit, re-entry, risk management, and position sizing techniques. Even some interesting fundamental and mass psychological aspects are incorporated.
Level 4 : script snippets or functions that do not disclose source code. Interesting element that can reveal market laws and work as raw material for indicators and strategies. If you find Level 1~2 scripts are helpful, Level 4 is a private version that took me far more efforts to develop.
Level 5 : indicator/strategy that do not disclose source code. private version of Level 3 script with my accumulated script processing skills or a large number of custom functions. I had a private function library built in past two years. Level 5 scripts use many of them to achieve private trading strategy.
אינדיקטור Pine Script®